Supply and Demand - Order Block - Energy CandlesSupply and Demand - Order Block - Energy Candles
Description
An experimental script, designed as a visual aid, to highlight the last up or down candle before a fractal break. We can assume these candles where the point of origin that generated enough strength to break recent structure. By using them as reference points, traders are expected to follow their own set of rules and mark higher probability supply and demand zones in the area.
How to use:
Expect a potential retest in these areas, and if they fail, a potential retest in the opposite direction. The greater the number of times a zone is tested, the more likely it is to break. A fresh zone that has not yet been tested will have a higher probability of a bounce.
Fractal period and candle break type can be personalised in settings. Can be used on all timeframes (higher the better).
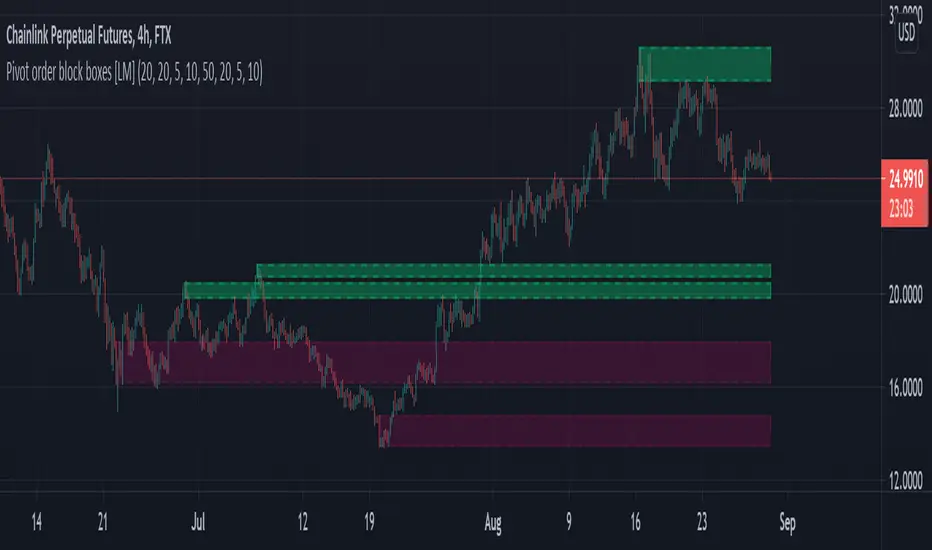
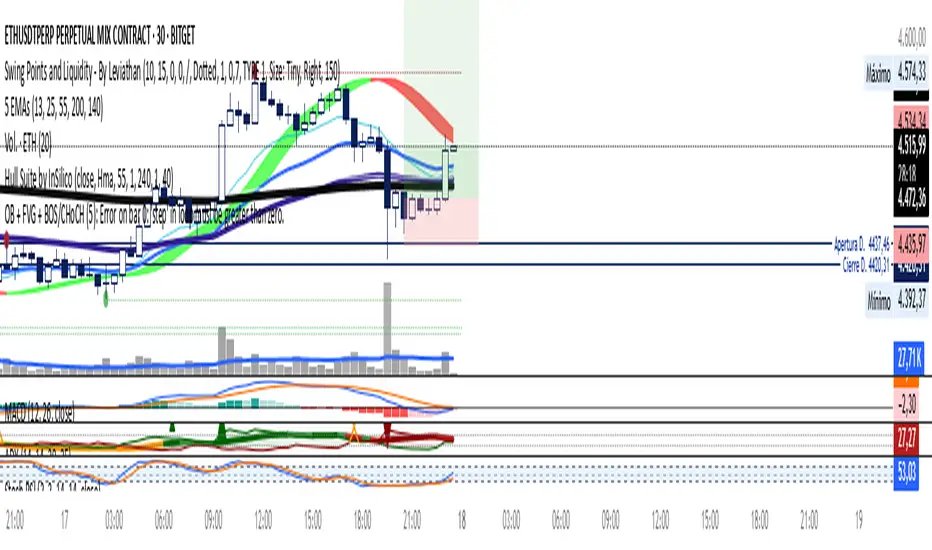
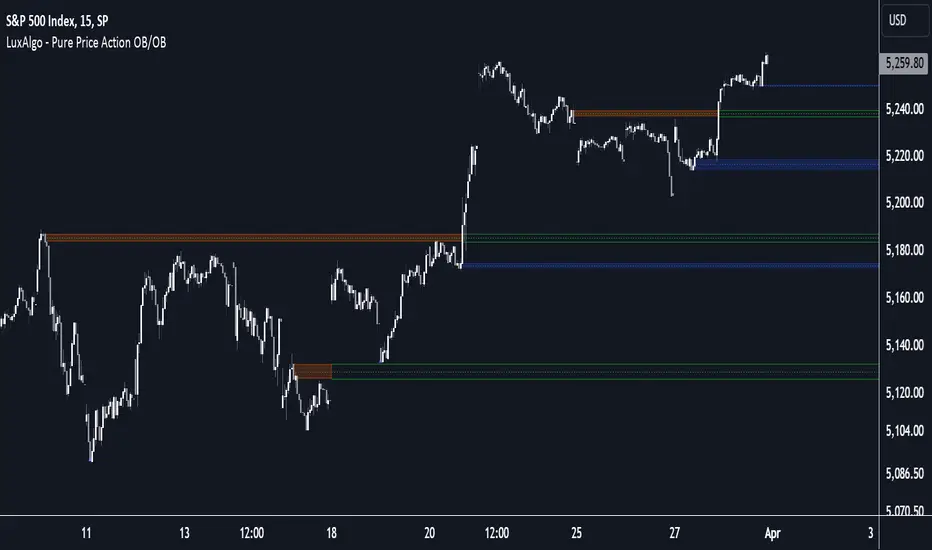
Indicator in use:
Extras:
An option to flip candle colours if current price is above or below them has been added.
Penunjuk Pine Script®